Multiple supply and demand factors affect seasonal natural gas and electricity spot [1]prices across the country:
Natural Gas
- Natural gas production level
- Supply disruptions
- Natural gas inventory levels
- Pipeline capacity constraints
- Weather
Electricity
- Reserve Margins
- Forced Outages
- Regional % of generation by fuel type
- Weather
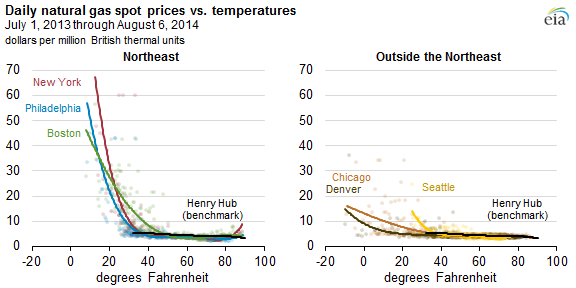
Out of all of these factors, weather tends to have the most significant influence in spot and near-term forward natural gas and electricity prices. History shows that shifts in temperatures are highly correlated with spot prices. The chart below shows that natural gas prices tend to rise as temperatures deviate from 60 degrees Fahrenheit. During the winter, when temperatures drop below 32 degrees, heating needs increase and spot prices follow suit. This effect is compounded in regions where extreme cold is prevalent during the winter and where pipeline constraints exist. In the Northeast for example, temperatures can drop below 20 degrees Fahrenheit, as occurred in January 2014. During these periods of high demand, generators and retail consumers compete to procure natural gas supply due to infrastructure limitations. Specifically, in New York and New England significant pipeline constraints remain despite major natural gas pipeline projects that have been coming in service since 2013. Such projects deliver additional natural gas supplies, mostly from the Marcellus region, into the New York City area (source: EIA).
[1] Spot Price can be defined as the current market price at which a particular security, commodity, or currency can be bought or sold for immediate payment and delivery (source- investinganswers.com).
During the summer, 26% of all US natural gas is burned by power plants that generate electricity for air conditioners to cool homes and buildings. In recent years, the Northeast has become more reliant on natural gas fired generation, and this trend is expected to continue. Some regions have a higher percentage of natural gas fired generation than others. For example, in 2013, natural gas generators accounted for 44% of net electric power sector generation in New England (source: EIA and U.S. Census Division). Nevertheless natural gas spot price spikes during the summer are not as pronounced as those during the winter. The chart above shows that prices surpassed $5/MMbtu last year when temperatures approached 90 degrees Fahrenheit, but only Transco Zone 6 NY got close to $10/MMbtu.
Natural gas spot and Day-Ahead Electricity price correlation
Besides the competition to procure gas between electricity generators and retail end users, when temperatures deviate significantly from 60 degrees Fahrenheit there is a higher probability of unforced power plant and natural gas equipment outages having the potential to magnify price spikes. This is why we see a very high correlation between natural gas and electricity spot prices. The table below shows some of the Northeast hubs and the respective delivery point/city.
|
NG Hub |
Electricity Hub |
City |
|
Algonquin Citygate |
Mass Hub |
Boston |
|
Transco Zone 6 NY |
NY Zone J |
NY City |
|
PJM West |
TETCO M-3 |
Philadelphia |
Forward Curve Correlation
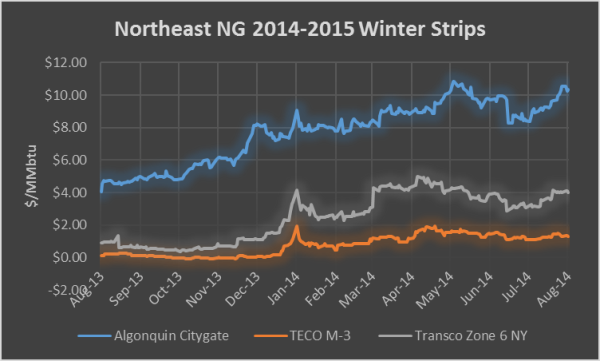
The charts below, show historical forward prices for the above mentioned natural gas and electricity hubs. The Northeast NG chart below shows that before the coldest winter in the last 30-years, natural gas basis for the 2014-2015 winter strip (NOV-MAR) had been trading sideways. Nevertheless, record breaking temperatures in early January 2014 lifted spot prices, which in turn, lifted forward premiums on supply fears. Since January, forward price volatility has been much higher.
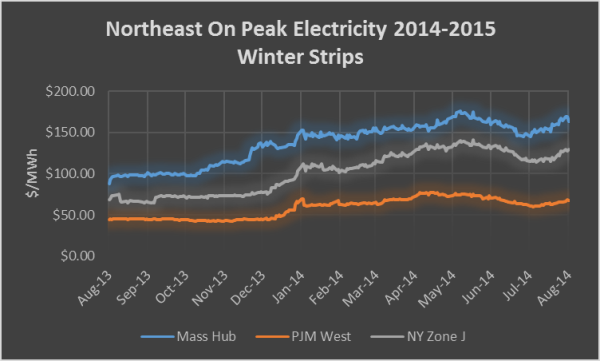
During the same period, electricity prices reacted in a similar fashion in these markets, which have high reliance on natural gas fired generation. The chart below shows historical On-Peak forward prices during for the same 2014-2015 Winter Strip. The electricity forward curves do not seem to be as volatile as forward heat rates and natural gas prices tend to have an inverse relationship. Nevertheless, when comparing both charts, it is evident how these Northeast hubs are highly correlated.
Conclusion
A black swan event, such as the 2014 Polar Vortex, highlights the need to proactively manage energy risks. End users that were not hedged during the 2013-2014 winter learned a hard lesson. We recommend to follow disciplined risk management strategies to protect end users against adverse price movements such as the ones described above. Contact your Acclaim representative to discuss what other strategies are available to you besides strategic sourcing.