While the 2013 summer months were relatively mild by Texas standards, the first week of September produced one surprise. On 9/3/2013, the Electric Reliability Council of Texas (ERCOT), reported a 15 minute interval Real Time price spike, which neared the current $5,000/MWh price cap. The market clearing price at 4:30pm (or 1630) was $4,900/MWH or $4.90/kWh when temperatures and power usage were high. While the $4,900/MW price only lasted one 15 minute interval, the simple average price across all load zones for hour ending 5:00pm was $2,333/MWh, or $2.333/kWh.
What happened on September 3, 2013?
While 9/3/2013 was certainly warm, it was by no stretch the hottest day of the summer. However, it did set a new price record in the ERCOT Real Time Market, raising the question as to why? There were two key reasons that caused the prices spiked:
1. Forced
Outages—while the ERCOT market was never in danger of rolling blackouts, the unexpected
loss of almost 1,213 MW of generation shortened the bid stack, putting upward pressure on prices. The sudden loss of generation occurred at 15:25 totaling 604 MW and frequency declined to 59.880 Hz while ERCOT’s load was 63, 035 MW. Another sudden loss of generation occurred at 16:23 totaling 609 MW and frequency declined to 59.917 HZ while ERCOT’s load had increased to 63, 373 MW; and
2. High demand—temperatures around the state were well in to the 90s, creating high
demand and forcing ERCOT to look to higher priced power plants to meet demand. Despite the Real Time price spike, power reserves remained above 3,000 MW so no advisory or emergency steps were triggered. Likewise, ERCOT did not call for conservation.
Graphical view of the event
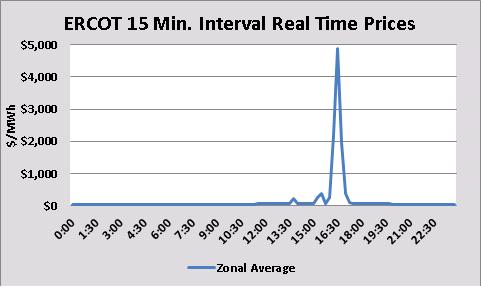
The following graphs show the 15 minute average Real Time market clearing prices in $/MWh of all load zones in the ERCOT region for September 3, 2013. The charts also show that there
were a couple of triple digit prints prior to the forced outages; however the big move started at 4:15pm.
Source: ERCOT website
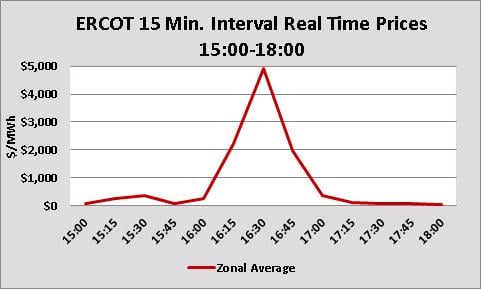
The following graph depicts the average Real Time prices from 3:00pm through 6:00 pm. A closer look at this interval range shows that Real Time prices returned to normal levels as fast as they reached the peak. This means that the shortage of operating reserves was alleviated within one hour as power balance in the interconnection system was restored. Not only does ERCOT maintain the following ancillary services: Regulation Service Down (REGDN),
Regulation Service up (REGUP) and Responsive Reserve-Services (RRS) to keep frequency within predetermined limits, but also to restore the ERCOT System within the first few minutes of an event that causes a significant deviation from the standard frequency.
Who will be affected by the price spike?
Even though this was a brief price spike, end users who are on a Real Time index product contract will be affected by the spike. Nevertheless, the effect of almost hitting the cap should not be that material to end users with exposure to Real Time prices due to the short length of the event. End users who have exposure to Real Time prices have the following electricity contracts:
- Index Contracts- Customers swing on ERCOT’s balancing prices are exposed to very high volatility
- Block and Index (B&I) Contracts- B&I products mitigates the exposure to Real Time price spikes since the only adverse effect will be when usage above the block (excess quantity) settles at the high Real Time Prices. Usage below the block (deficit quantity) will result in a credit to the customer, as the deficit quantity gets liquidated at the Real Time price.
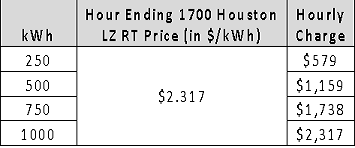
The table below shows hourly charges as a function of different hourly usage (in kWh) quantities settling against the Real Time price spike of hour ending 1700.
Conversely, customers who have contracted a Fixed Price Load Following product, should not feel any impact to Real Time price spikes if their usage is within their contract Tolerance Band. Under this product structure suppliers includea swing premium in their price to wear the Real Time price risk.
Conclusion
The 9/3/13 event highlights the potential for extreme volatility and high prices in the Real Time power market in the event of a supply shortage. Even a few hours of high energy prices can eliminate any savings which could be realized as a result of being on an index based product. The examples above are meant to show how adverse prices in the Real Time market can
affect end users depending on the product structure under contract. Contact your energy advisor to determine what the best product structure for your business is, to develop a risk management strategy that will take in account the variability of index prices and how to take appropriate steps to mitigate this risk.