IS THE SUMMER ALMOST OVER?
5 PRICE DRIVERS THAT CAN IMPACT NATURAL GAS AND ELECTRICITY PRICES
Weather
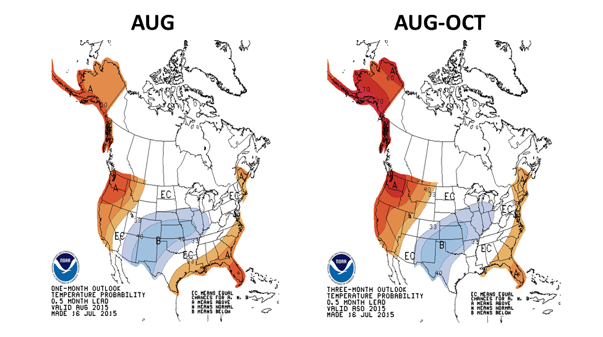
The latest National Oceanic and Atmospheric Administration (“NOAA”) one month (Aug-15) and three month (Aug through Oct-15) forecasts are showing similar weather pattern. The maps below show that central states will experience below normal temperatures, while above normal temperatures will likely prevail across both US coasts. Even though above-normal temperatures were more prevalent in the continental U.S. during the first week of August, the latest weather forecasts are showing mostly normal to below normal temperatures in the eastern half of the country through 8/20/15, while above-normal conditions are expected in Texas and the Southwest.

Regarding El Niño, the National Weather Service According released an "El Niño Advisory" on July 9, 2015 that forecasted a greater than 90% chance that El Niño will continue through Northern Hemisphere Winter 2015-2016 and around an 80% chance it will last into early spring 2016. Moreover, the report stated that temperature and precipitation impacts associated in the continental states are expected to remain minimal during the Northern Hemisphere Summer and increase into the late fall and winter. Reviewing analog years with a strong El N Niño, it is likely that precipitation could provide some relief in the West during the 2015-2016 winter.
Natural Gas Production
U.S. shale gas production remains at record high levels; however, there are some signs that it is flattening and could start declining in the coming months. Marcellus and Utica production increased slightly over May; however the rest of the shale gas plays declined over the same period. For the week ending on July 31, 2015, dry natural gas production averaged 72.1 Bcf/d for the report period, a week-over-week increase of 0.3%, according to data from market analytics company Bentek Energy, and a 4.8% increase over the same period last year. Strong production has contributed to an oversupply, which has allowed inventories to replenish above the 5-year average. Consequently, natural gas prices have remained in check and rallies have faced strong headwinds when prices attempt to reach $3.00/MMBtu resistance.
Storage
There is a surplus of working gas in underground storage of 22.5% against last year’s level, and 2.2% against the 5-year average. Inventories have recovered significantly from the last two winter deficits that were caused by colder than normal temperatures. Record production from the shale plays has replenished inventories at a faster than expected rate due to oversupply conditions. The latest Energy Information Administration Short Term Energy Outlook report, which was published on July 7, 2015 stated that inventories were projected to total 3,919 Bcf, 115 Bcf (2.9%) above the five-year average by the end of Injection season. The table below shows some projection on storage levels at the end of the injection season and a comparison against the delta against the 5-year average level.
|
Remaining Injection Scenarios |
Natural Gas in Underground Storage (in Bcf) |
Avg. Weekly injection estimate (in BCF) |
Projected inventory level at the End of Oct-2015 (in Bcf) |
Inventory at the End of October (in Bcf), 5-year avg. |
% Difference vs. 5 year avg. at the end of the injection Season |
|
EIA 2015 Forecast as of 7/03 |
2,668 |
69.5 |
3,919 |
3,805 |
2.9% |
|
Assuming 2014 injections as of 7/31 |
2,912 |
88.4 |
4,061 |
3,805 |
6.3% |
|
Assuming 5-year average inj. as of 7/31 |
2,912 |
69.9 |
3,961 |
3,805 |
3.9% |
Peak of Hurricane Season
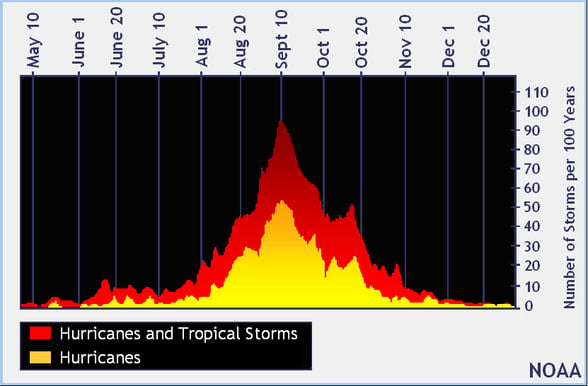
Historically, the peak of the Hurricane season occurs during the 2nd week of September. The Weather Channel (TWC) and NOAA recently revised their hurricane forecasts downward for 2015 as follows:
| Average | NOAA | TWC | |
| Total Named | 12 | 6-10 | 10 |
| Hurricanes | 6 | 1-4 | 4 |
| Category 3 or Higher | 3 | 0-1 | 1 |
NOAA's updated 2015 Atlantic Hurricane Season Outlook indicates that a below-normal hurricane season is very likely. The outlook calls for a 90% chance of a below-normal season and a 10% chance of a near-normal season, with no realistic expectation that the season will be above-normal (Source: NOAA).
El Niño will likely contribute to a below normal Atlantic Hurricane Season because it tends to create unfavorable upper level winds that are less conducive for the formation of storms. Nevertheless, any storm that makes its way to the Gulf of Mexico will result in a short lived bullish reaction.
The chart below shows that we are approaching the peak of the hurricane season, when conditions are more favorable for the developments of storms.

Technical Trading
Trading volume and volatility tend to be higher across the front months of the curve (up to 6 months out). Besides market fundamentals, technical indicators are a critical tool to predict future price levels or price direction through the analysis of historical patterns. Timing is essential for a risk management strategy to be successful, so technical indicators complement fundamental analysis to provide a clearer picture of trends, changes in market direction, and momentum. When fundamental information is inconclusive, technical trading takes over as traders rely on technical market signals to anticipate short-term price movements.Conclusion
The combination of the following generation fleet infrastructure changes in the U.S. has changed the usage profile of natural gas and electricity in the U.S.
-
Coal Power Plant retirements
-
Growth in Natural Gas-fired generation
-
Growth of Renewable generation
Natural gas demand from the power sector (“Power Burn”) has increased significantly in recent years. In 2015, Power Burn reached record levels during the peak of the summer season and is now competing with natural gas that needs to be injected into underground storage to supply winter heating demand. Therefore weather has become one of the main drivers of near-term price direction during the summer. Despite warmer than normal temperatures across consuming region during the last week of July and the first week of August, natural gas prices have struggled to reach $3.00/MMBtu.
Forward prices rose in ERCOT after Real-Time prices topped $850/MWh during peak hours on 8/5/2015. Expectations of sustained above-normal temperatures in Texas through 8/16/2015 spooked the market and Heat Rates spiked across the curve. Therefore, market sentiment in ERCOT will remain bullish due to expectations of strong cooling demand through the first half of the month. Fixed prices in all other electricity market have remained flat.
Even though production is showing signs of contraction it is still very robust. If temperatures do moderate across the eastern half of the country, we should see an increase in injections which would widen the storage surplus against the 5-year average level and limit price gains in natural gas and electricity. It is likely that the low price environment will continue through the peak of the summer, and the stage is setting for better buying opportunities during the fall.


