So far, the 2013-2014 winter has been exceptionally cold across the eastern half of the U.S. Arctic outbreaks and the bitter cold winds from the Polar Vortex have spilled across major natural gas consuming regions. Massive draws from inventory have been needed to meet surging demand for heating from the residential, commercial and electric power sectors. This season has been characterized by withdrawals that have been much larger than average.
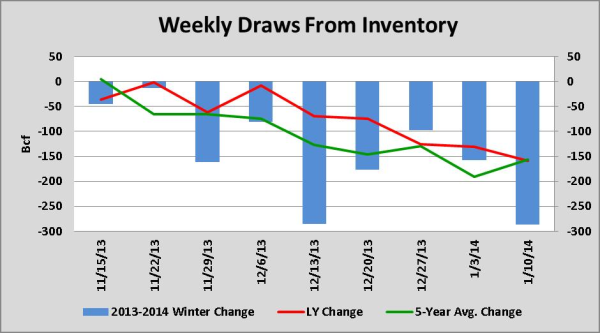
The chart below shows that six out of the last nine withdrawals from inventory have been higher than those from last year and the five-year average for the same week. Consequently, storage levels are lower than normal for this time of the year. With two months of winter left, unusually low inventories could raise concerns about tight natural gas supplies at the end of the withdraw season, which typically ends in late March. If storage levels decline below 1,200Bcf, it would be the lowest level in nine years when inventories stood at 1,017MW on March 25, 2004. The latest National Oceanic and Atmospheric Administration (NOAA) 6-10 & 8-14 day weather forecasts are calling below normal temperatures in the eastern half of the country as a jet stream is blocking Arctic air from hitting the west coast, but is allowing the storms to dip down the into the Ohio valley, upper Midwest and great lakes. Computer models show that this ridge is very stable, so this weather pattern could remain in place at least ten more days.

Source: EIA
On January 16, 2014, the Energy Information Administration (EIA) posted a record-high net withdrawal of 287Bcf from underground storage facilities for the week ending January 10, 2014. This was the largest draw in 20 years for which storage data exists. The 287 Bcf draw was the second record-breaking weekly stock draw this winter season. The first record of 285 Bcf, which was posted on December 19, 2014, for the week ending December 13, exceeded the previous record of 274 Bcf from January 2008.
Cumulative 2013-2014 winter weekly withdraws up to January 10, 2014, are well above those of last year and the five-year average:
|
Period |
Cumulative winter draw through January 10 (in Bcf) |
|
2013-2014 |
-1,304 |
|
2012-2013 |
-668 |
|
5-year average |
-951 |
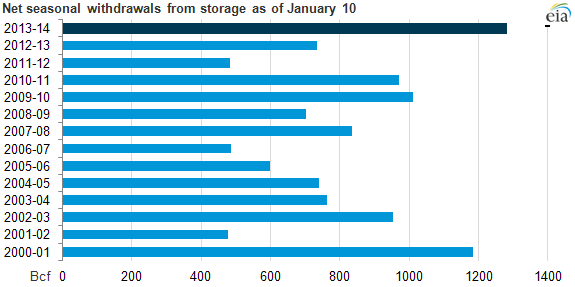
The chart below shows that winter draws have even exceeded the previous record level posted in the 2000-2001 heating season.

Besides higher than normal draws, Bentek reported that cold temperatures affected natural gas production as Freeze-offs occurred in the Marcellus Shale and Fayetteville Shale during the week ending on January 10. Production has recovered since then, but could face challenges during the next ten days due to the second round of Polar Vortex blizzard like conditions. The combination of high demand and lower supply triggered physical natural gas basis spikes last week in the Northeast as pipelines reached full capacity. Two trading hubs that rallied significantly were Transco Zone 6 NY and Algonquin Citygate, which serves Boston.
Currently working natural gas in underground storage stands at 2,530Bcf, which is almost 15%, or 443Bcf, lower compared to the 5-year average. January is typically the month that registers the highest demand of the winter season, so the next three draws will have strong implication on near-term price action. If we were to extrapolate the same draws from last year and the five-year average for the remainder of the 2013-2014 winter season, natural gas inventories would end at 1,016Bcf and 1,380Bcf respectively. Consequently, the tight natural gas supply outlook coupled with frigid near-term weather forecasts for the eastern half of the nation will provide price support and will most likely entice speculative buyers. Commercial and Industrial consumers with open natural gas or electricity index exposures should manage risk against potential price spikes. Contact your energy advisor to discuss how you can protect against adverse prices movements.


