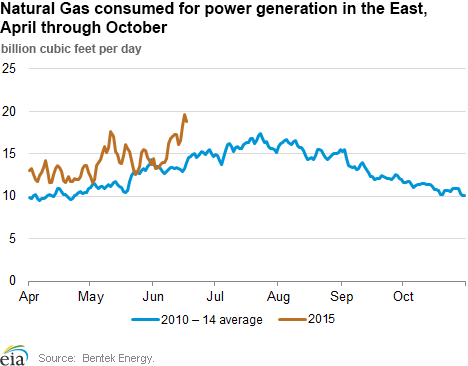
Natural gas use for power generation (“Power Burn”) has trended higher in 2015 compared to the 5-year average (2010-2014).

The increase in 2015 is due to the following three drivers:
-
Low natural gas price environment: Above normal Power Burn has an inverse correlation with low natural gas prices as utilities switch from coal to natural gas when spot prices trade below $3.50/MMBtu.
-
Above normal temperatures in consuming regions: Hot weather drives electricity demand for air conditioning in consuming regions. Above normal temperatures in the eastern half of the country have boosted demand significantly during the past couple of months.
-
Changes in power generation infrastructure: In June, the Energy Information Administration (EIA) reported that total natural gas-fired electric generation in April-2015 surpassed coal-fired power generation for the first time in history. Approximately 31% of electric power generation came from natural gas, whereas coal accounted for 30%.
-
Retirement of Coal Generation- As a result of compliance with U.S. Environmental Protection Agency regulations, primarily the Mercury and Air Toxics Standards (“MATS”). In 2015, nearly 13 GW of coal-fired generation capacity is expected to retire. Most of this retiring coal capacity is found in the Appalachian region: slightly more than 8 GW combined in Ohio, West Virginia, Kentucky, Virginia, and Indiana. Despite the 6/29/15 Supreme Court decision to reject MATS, many power plant operators had previously decided that retrofitting units to meet the new standards would be cost-prohibitive and chose to retire units instead. The coal fired plants to be retired are older, smaller and operate at a lower capacity factor than average coal-fired units in the United States. (Source: EIA)
-
Development of New Natural Gas fired Generation- According to the EIA, natural gas additions in 2015 will be spread out throughout the country, but Texas will add more than double that any other state (1.7 GW, 27% of total natural gas additions). There are also many additions in the Mid-Atlantic region, with more than 1.6 GW, or 26% of total natural gas additions, expected in New Jersey, Pennsylvania, Delaware, and Maryland (Source: EIA).
-
Regional Power Burn:
Each region across the U.S. has a different generation fuel mix and different fuel costs. Both of these market fundamentals weigh in the amount of Power Burn nominations.
West (California and Pacific Northwest )- In California, the growth in renewable generation has curbed Power Burn demand as net load during on peak hours has decreased. In other words, renewable generation has the potential to significantly displace natural gas fired generation.
Power Burn in the Pacific Northwest is at record levels due to above-normal temperatures, which has increased cooling demand. Moreover, due to the drought in the region, natural gas has filled the gap left by lower hydroelectric generation. Nevertheless, the level of above-normal natural gas consumption in the Pacific Northwest is immaterial compared to the total U.S. Power Burn.
Midwest- Current Power Burn in the region is at the 5-year average. Coal is the marginal fuel in the region and even with lower basis prices storage in the region demand from the power sector has been much lower compared to 2012, when power burn reached record high levels. Consequently, Power Burn is currently competing with natural gas that is injected into storage, which means that prices would need to go lower to boost Power Burn in this region.
Northeast- Power Burn in the region is currently well above the 5-year average, raising natural gas demand by nearly 2 Bcf per day. One thing to consider is that at even if prices go below $2.50/MMBtu Power Burn has been maxed out in this region.
Summary & Conclusion
According to market analytics company Bentek, natural gas burn for 2015 will average 25 Bcf/day, returning to a level last seen in 2012, when spot natural gas prices plunged to a 10-year low below $2.00/MMBtu. Moreover, in 2012, the increase was the result of record-high natural gas inventories at the end a warm winter coupled with an unusually hot summer that raised demand for gas-fired generation to meet air conditioning demand.
So far this year, the Northeast and the Southeast have led the growth in natural gas demand over 2014 daily demand levels. As we approach the heart of the summer season, the level of daily Power Burn nominations will be a function of weather and spot prices.
Looking past 2015, the drivers that will affect Power Burn the most, other than weather, will be infrastructure changes that take place as a result of EPA’s Clean Power Plan compliance and growth of Renewable generation which tends to displace natural gas fired capacity.
If natural gas production remains at current record levels, and assuming Power Burn remains above the 5-year average during the summer, Henry Hub natural gas spot prices would have a difficult time breaching $3.00/MMBtu resistance. In the event of a mild temperatures during the second half of the summer we could see prices test lower levels during the fall when electricity demand drops.
Contact your Acclaim Energy representative (713-524-0250 or visit our website, www.acclaimenergy.com ) with any questions you may have about ever changing energy market dynamics.


