
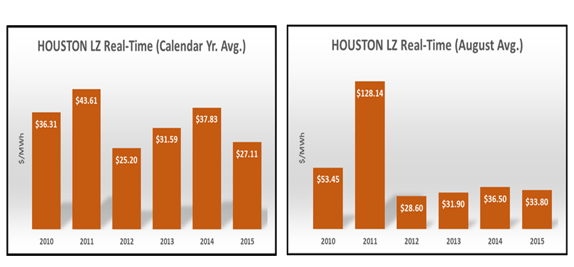
Typically, in most deregulated markets, monthly Real-Time (“RT”) settlement price averages are lower compared to monthly forward electricity prices; however, due to high volatility, index (variable) prices can be very risky for commercial and industrial (“C&I”) consumers. Forward prices are higher because consumers or speculators are willing to pay a premium today for electricity that will be delivered in the future, rather than being exposed to price risk. Depending on the market and risk appetite, electricity consumers should be aware of the risk/reward profile (incremental cost vs. potential savings) of an electricity index product. In some markets, like ERCOT, being exposed to RT index prices could be a very risky proposition since the RT prices are now capped at $9,000/MWh (or $9.00/kWh). The risk of prices reaching such price cap could blow the annual budgeted electricity spend of any C&I consumer. The charts below shows calendar year RT price averages for the Houston Load Zone (“LZ”) since 2010.
Historical Analysis
Calendar year RT prices in 2012 and 2015 (JAN-AUG) were exceptionally low due the low natural gas price environment in the U.S. In ERCOT, natural gas is the marginal fuel that sets the clearing price of electricity most of the time, so there is a high correlation between natural gas and electricity spot prices. Calendar year RT prices in 2011 were very high because of price spikes in February and August when RT prices hit the cap across multiple 15-Minute intervals. Moreover, Texas recorded the hottest June through August 2011, according to the National Weather Service. Due to the combination of a severe drought and sustained above normal temperatures across all major cities the grid experienced record peak demand. ERCOT declared emergencies events multiple times and shut power down to interruptible customers twice to avoid widespread rolling outages. In 2011, Houston LZ RT prices hit the then effective cap of $3,000/MWh a total of sixty eight 15-Minute intervals as follows:
|
Month |
# of 15-Minute intervals at the Cap ($3,000/MWh) |
Equivalent hours |
|
February |
13 |
3:15 |
|
March |
1 |
0:15 |
|
June |
1 |
0:15 |
|
August |
53 |
13:15 |
|
Total |
68 |
17:00 |
Consequently, 2011 has the highest calendar year and August averages during the reporting period. The chart below shows that Houston LZ RT prices in August 2011 averaged $128.14/MWh, which is well above any other August since 2010. The charts below shows calendar year and August RT price averages for the Houston Load Zone (“LZ”) since 2010.
RT Spikes Potential Impact on Energy Spend
The table below illustrates how an increase in RT price prints at the cap materially affects energy spend if fully exposed to RT prices. We used 2014 as our base case and used $9,000/MWh as the effective price cap. In 2014 the cap was reached only in 4-Minute intervals. To estimate energy spend we assumed annual usage of 27,000,000 kWh, so the only variable is the number of intervals at the $9,000/MWh cap. The difference in energy spend between 1 and 20 hours at the cap would have been almost $500,000 (or 46% higher) for this consumer.
|
Hours |
15-Minute intervals |
*Average Price $/MWh |
Average Price $/kWh |
Energy Spend |
Difference vs. Base Case |
|
1 |
4 |
$38.23 |
$0.03823 |
$1,032,210 |
$0 |
|
5 |
20 |
$41.46 |
$0.04146 |
$1,119,420 |
$87,210 |
|
10 |
40 |
$46.10 |
$0.04610 |
$1,244,700 |
$212,490 |
|
15 |
60 |
$50.89 |
$0.05089 |
$1,374,030 |
$341,820 |
|
20 |
80 |
$55.72 |
$0.05572 |
$1,504,440 |
$472,230 |
*Energy Only Prices
Operating Reserve Demand Curve (ORDC) - What has changed?
On June 1, 2014, ERCOT implemented a price scarcity mechanism to improve market signals when operating reserves (planned operating generator capacity) are low. The change in protocols allowed ERCOT to combine RT energy prices with a RT reserve price adder, the Operating Reserve Demand Curve (“ORDC”), to reflect the value of available reserve capacity when ERCOT experiences reserve shortages to incentivize resources to generate more electricity. Therefore, ERCOT now adds a Real-Time ORDC adder (“RT ORDC”) to Locational Marginal Prices (“LMP”) to calculate the total effective RT Settlement Point Prices (“SPP”), which becomes the applicable settlement price for load if contracted under an index product. Since implementing these new protocols, RT prices remained quite soft, but during August 2015 we saw the first significant price spikes under the new market design. The two charts below illustrate price spikes during two consecutive days. Even though the RT LZ prices spiked close to the same levels, the composition of LMP (energy-based component) and RT ORDC differed considerably.
On 8/12/2015, ERCOT’s current day forecast fell well short of actual hourly demand. Starting at hour ending 12:00, actual demand topped the morning forecast by more than 1,000MW, which depleted operating reserves faster than expected. As a result the LMP component of the price averaged $70/MWh over the next four hours (see the short red column section across the displayed time periods below), while the RT ORDC rose as high as $785/MWh during the same period (see large blue column sections). In other words, this price spikes were driven by the ORDC (reserve) component of the SPP.
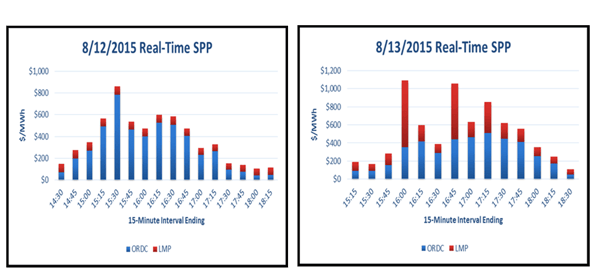
However, the next day, ERCOT’s forecast closely matched actual demand, meaning that adequate supplies were procured to meet peak demand. Nevertheless, during a couple of intervals ERCOT had to go deeper into the supply stack to meet high peak demand. This resulted in LMPs running considerably higher than the RT ORDC during two 15-Minute intervals (see intervals ending 16:00 and 16:45).
Conclusion
In April 2012, the PUCT approved two proposals to raise the system wide offer cap from $3,000/MWh in 2011 up to $9,000/MWh beginning on June 1, 2015. Therefore the risk of being served under an index contract has increased materially. Obviously, the risk is much higher during the peak of the summer and winter season, so structuring a blended block and index product could still be appealing to consumers who have a higher risk appetite. Customers who are risk averse and require budget certainty should stay away from index products in markets like ERCOT. Moreover, the forward curve is currently at historical low levels, so it is hard to justify the benefit of marginal savings with an index product. The flat forward curve is providing amazing long-term fixed price opportunities to hedge future exposures.
The potential of RT LZ SPP prices hitting the $9,000/MWh cap is an opportunity for consumers who can shed load or dispatch distributed generation to create revenues from such price spikes (“Economic Response”). If you fall under one of these scenarios, contact your Acclaim Energy representative to discuss how to structure your supply contract to benefit from Economic Response.
The examples above illustrate the behavior of RT LZ SPP prices under two different scenarios. Understanding RT index prices is critical to manage risk and optimize opportunities to maximize revenues.
